I am developing an aggregator service using a DAG orchestrator that involves numerous API calls within a workflow comprising parallel and sequential nodes. I aim to create a profile to identify which API calls in this graph consume the most time. Are there any recommended tools or methods for profiling and analyzing the performance of these API calls within the context of a DAG workflow?

2 Answers
Go offers some great tools and libraries for Profiling and analyzing the performance :
1. Go's pprof Package
First off, if you're not already using it, Go's built-in pprof package is a great for performance analysis. It lets you gather various profiles like CPU, heap, and goroutine blocking. This can be super helpful to pinpoint functions eating up your CPU or memory. Integrating pprof into your app allows you to start and stop profiling around your API calls, and you can even access this data over HTTP for live apps using the net/http/pprof handler.
2. OpenTelemetry for Distributed Tracing
For a more distributed approach, OpenTelemetry is fantastic. It's an entire ecosystem dedicated to observability (tracing, metrics, logs) and works like a charm for Go applications. With OpenTelemetry, you can trace your API calls across your DAG, maintain context across async tasks, and then export this data to tools like Jaeger or Zipkin for visualization. This is especially useful for understanding the flow and performance of your API calls in real-time.
3. Using APM Tools
If you're looking for something a bit more hands-off and automated, APM (Application Performance Monitoring) tools like New Relic, Datadog, or Dynatrace might be up your alley. These platforms have Go agents that can automatically instrument your app, giving you insights into API performance, error rates, etc., without much manual setup. They're incredibly powerful and can provide deep insights with minimal effort.
4. Don't Underestimate Custom Logging and Metrics
Sometimes, there's no substitute for good old-fashioned custom logging and metrics, especially for specific insights that automated tools might not catch. Using Go's log package or a third-party library to log API call durations, combined with a metrics library like Prometheus, can give you that granular control and insight into your app's performance.
In my experience, a combination of these tools often yields the best results. You might start with pprof during the development and testing phases for detailed profiling, implement OpenTelemetry for ongoing observability in production, and consider an APM for advanced monitoring and anomaly detection. Custom logging and metrics can fill in any gaps, giving you a comprehensive view of your app's performance.
Hope this helps! It sounds like a challenging but rewarding project.
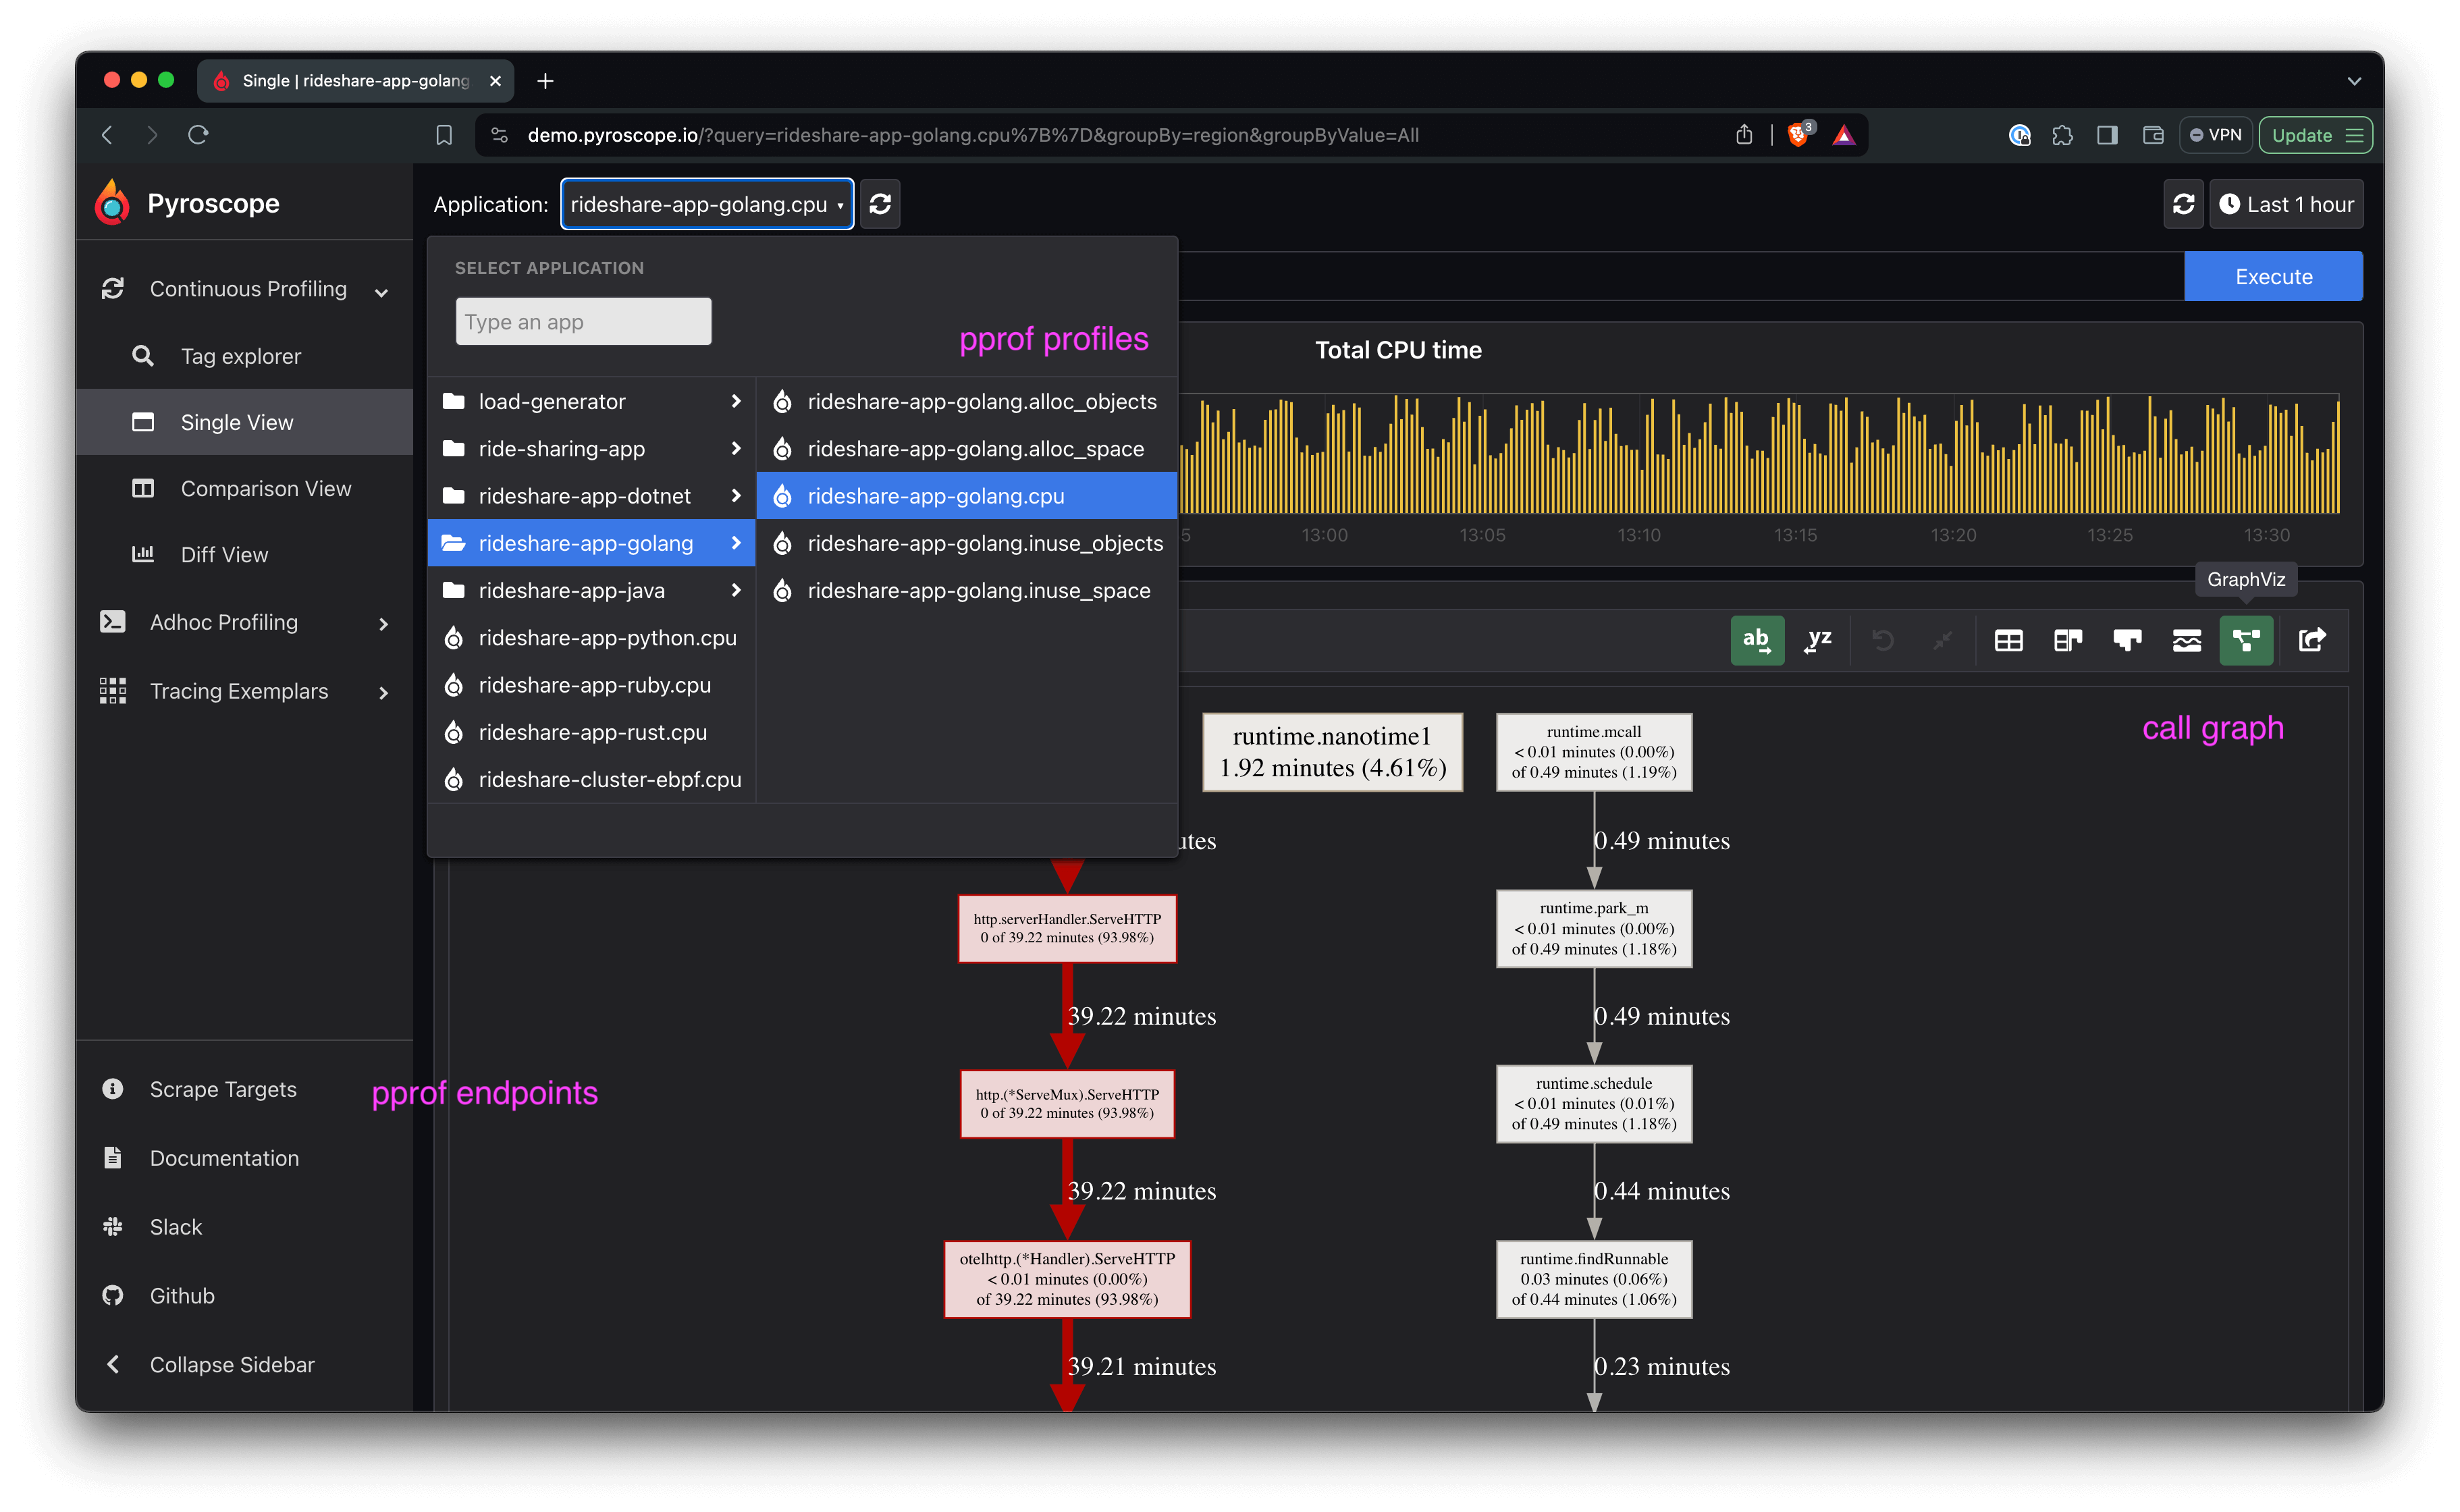
In addition to the pprof handler you can configure it as a scrape target for pyroscope. There's an open source offering that's low effort to setup. That will give you some visualizations around the profile data collected from pprof endpoints. There is a live demo for a sample go app if you want to check it out.
My screenshot shows the graphviz call graph visualization for the selected pprof profile. This is a good way to analyze the performance and flow of api calls. The other visualizations and options are useful too: