Beyond pprof what tools are you using to profile production work loads?

2 Answers
I've created basic example repository showing how to use pprof with pyroscope:
https://github.com/calmdev/go-pprof-pyroscope
This will start a web server with pprof endpoints. Pyroscope runs as an additional service that is configured to collect metrics from the pprof endpoints. As profiling data is collected this information becomes available to analyze within the UI.
To try it – clone the repository and re-open in dev container.
Start the web server:
go run main.go
Access profile data using the pyroscope UI:
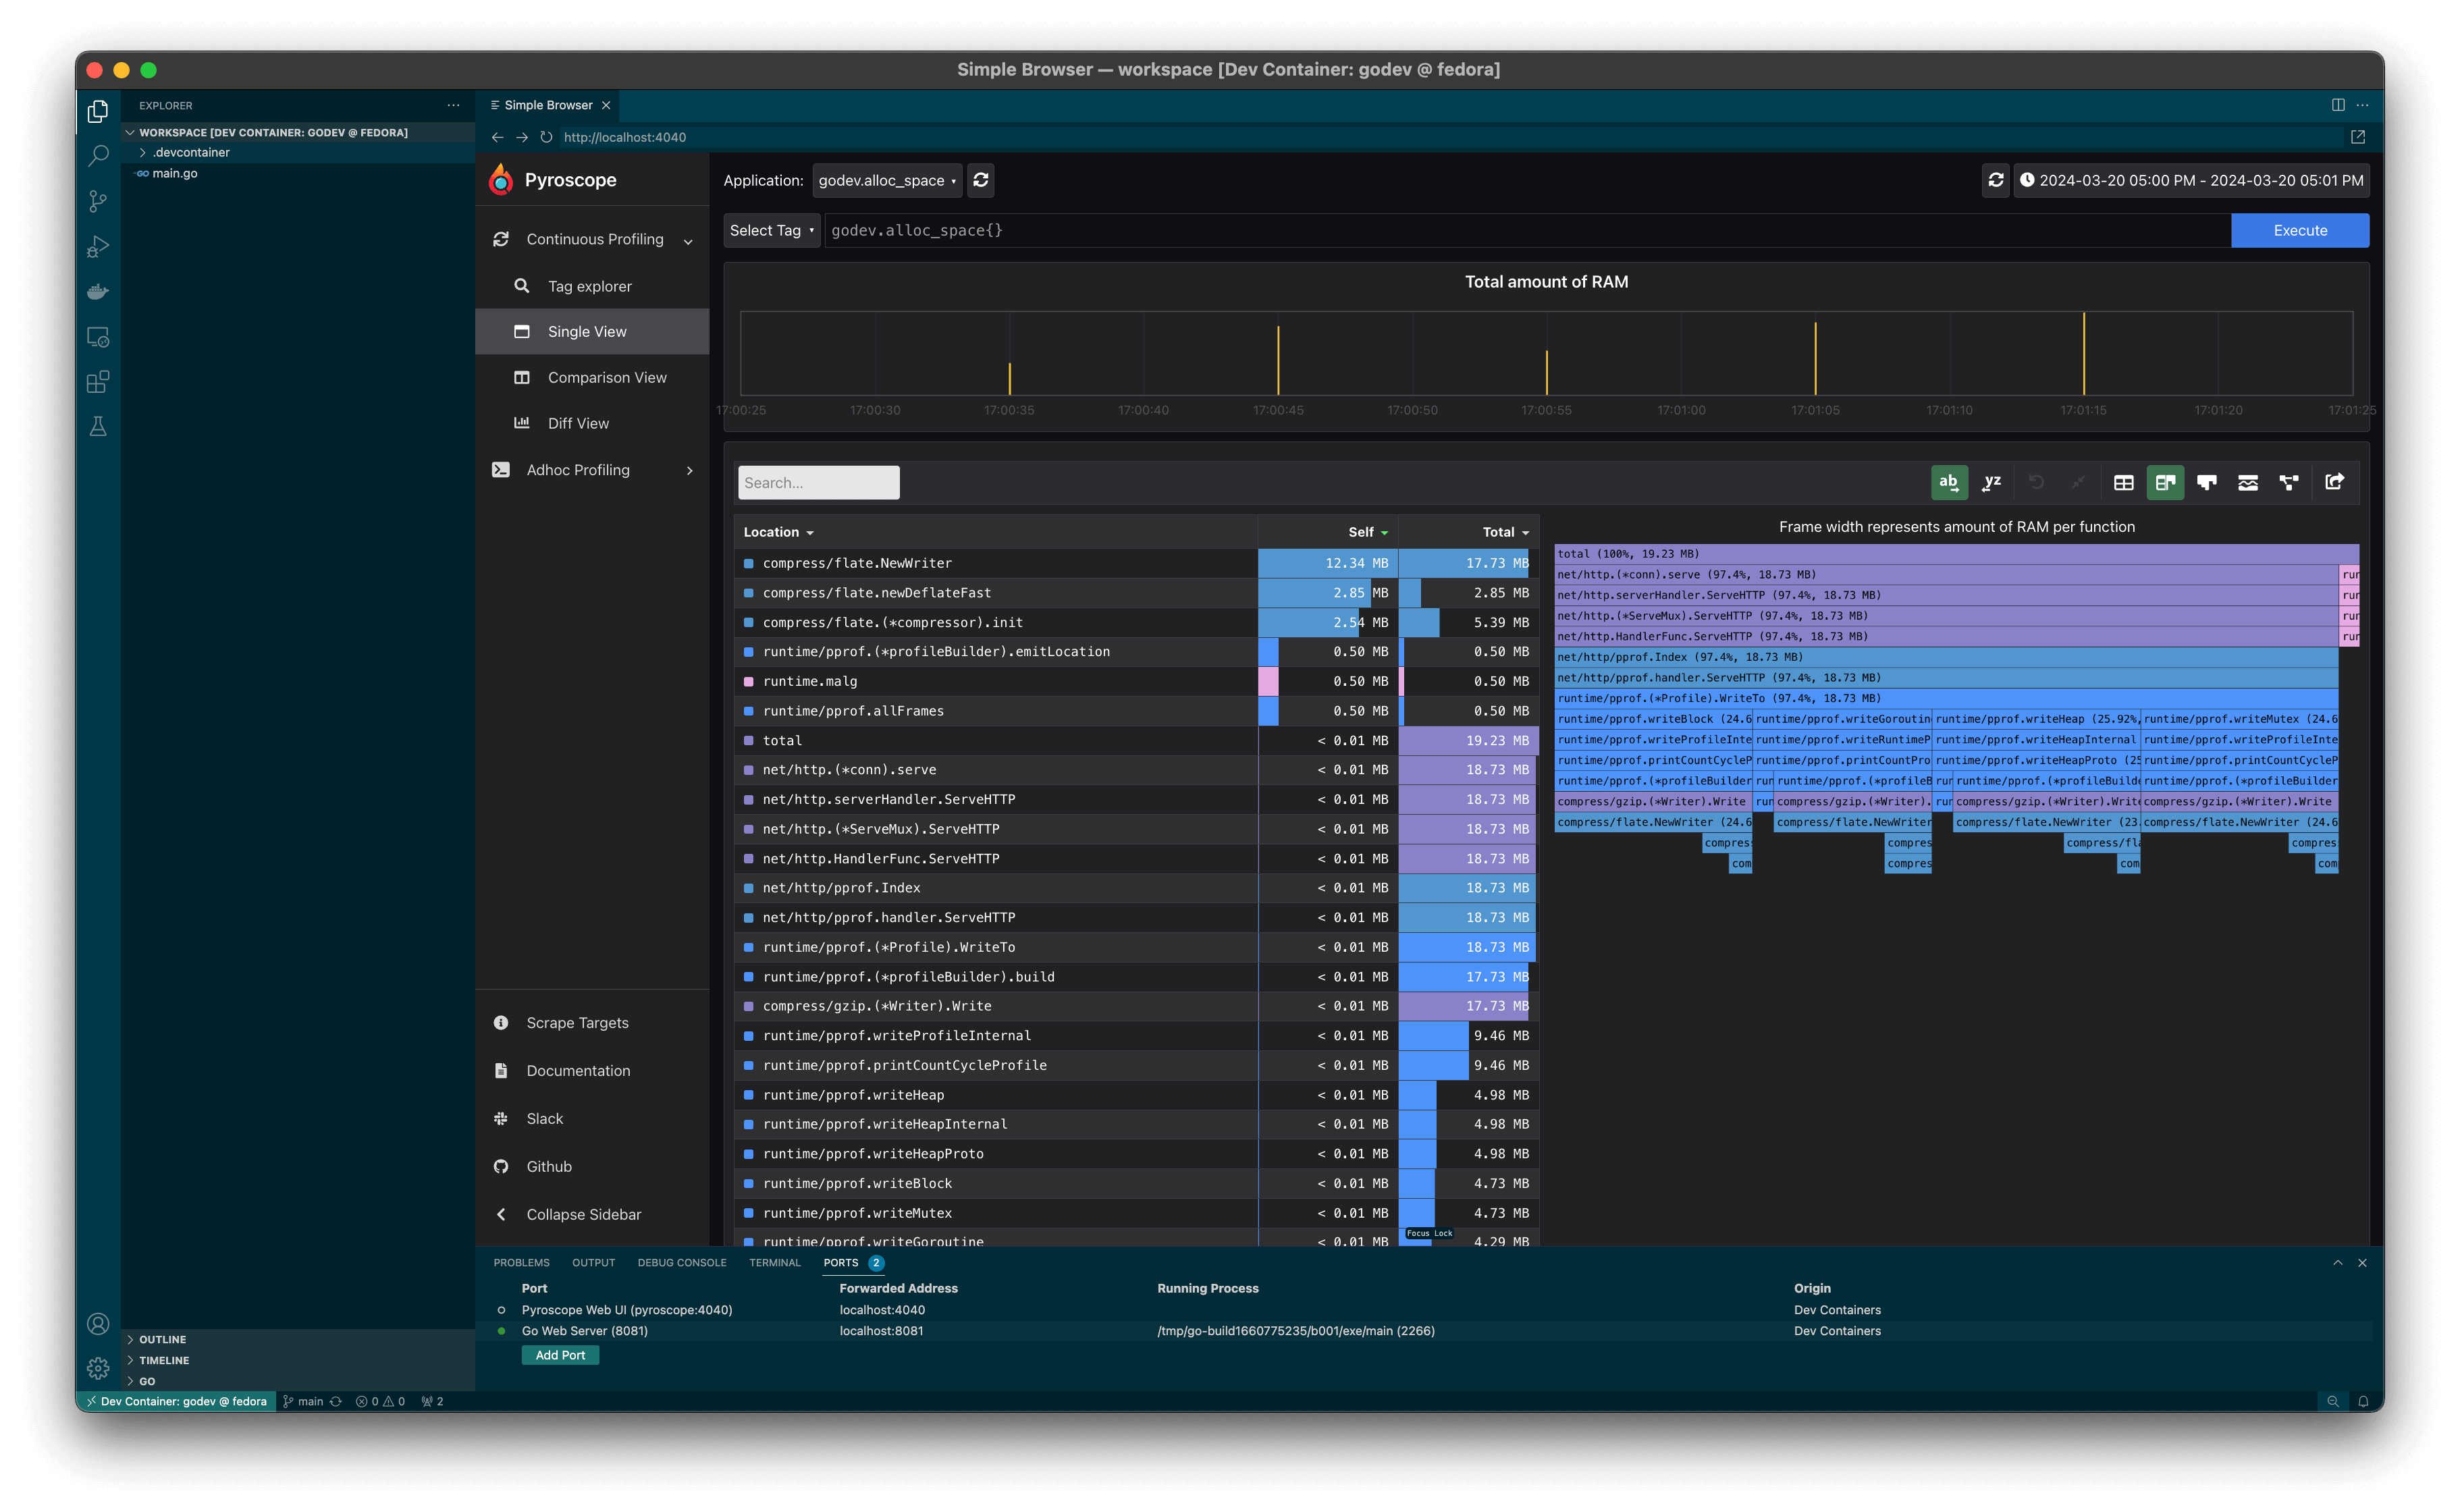
http://localhost:4040
Here's a screenshot: